The Community forums are being phased out in favor of a new Slack group.
Add your email address below to get an invitation to join the community slack group
how to use a hidden field as a parameter in a graph
hi, I need to create a graph associated for the current user (a doctor), this user has several patients (each patient has an unique hidden id field), so, I need to graph the blood preassure of a particular patient according the doctor and the hidden field id. Any idea? I did it in excel in less than 1 minute, but here.... another story.... sorry, I feel frustrated.
July 14, 2017 at 5:38 am
Hidden fields should work as any other field in your graph. I just created a form in my development environment that includes hidden fields and they display just fine on a graph. Just add the field id to the shortcode. https://formidableforms.com/knowledgebase/graphs/
July 15, 2017 at 8:48 am
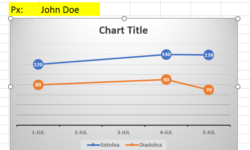
thanks for your answer. Actually it helped me a lot. I still have a question and maybe you could be so kind and give me a light in my darkness. I have a list of doctors and each doctor has several patients. All the data is private to each other of course. So, only the doctor providing service to a patient can see the information regarding to him/her. One of the information that is taken is the blood preassure. so... I need a graph that gives me the historical blood preassure behavior for the patient associated to the doctor. The code I am using is: [frm-graph fields="1126,1127" type="column" x_axis="created_at" data_type="total" user_id="current" show_key="1" y_not_equal="" x_not_equal=""] where 1126 is systolic and 1127 is diastolic. The hidden field is actually the patients id and I don't know how to use it as a parameter in the graph. The problem is that this graph makes a ridiculous sum of the blood preasure since the only option I have is TOTAL. What I need is a graph that shows the data per event through time. The attached graphic was made in Excel, and to0ks me 2 minutes.... I have been struggling with this for several days and at this point I am very frustrated.
I will appreciate any advice or help with the shortcode. again, THANKS
Attachment:

July 15, 2017 at 10:32 am
After reading through the FrmProGraphsController source code, I think you could use the frm_graph_data filter to generate your own data points and bypass the calculations Formidable performs on your entries. The built-in calculations take place before the filter is applied, which means you can override the calculations. This will require custom code that would take about a day to write and test. Maybe someone here has another alternative, but I don't see it.
July 15, 2017 at 11:04 am
Thanks!! It is very disappointing that Formidable Forms isn't able to handle a very simple graph like that. I appreciate your advice and am very thankful for taking time in answering to my question.
Best regards!
Discussion closed.